

Bee: An Interactive Installation
MFA Thesis Project Teaser
Teaser video for the interactive art installation I created as part of my MFA thesis at DigiPen Institute of Technology. This project was created with the help of a small team of four undergraduate programmers and designers called Guerilla Nouveau.
Role: Art director, team lead, principal artist

Introduction

Bee: An Interactive Installation is a custom hardware exhibit that utilizes Arduino, capacitive touch sensors, and projectors. It was created as part of my Master of Arts in Digital Arts thesis project at DigiPen Institute of Technology. My thesis focused on examining UI/UX principles through interactive art.

Early Concepts

This was a design for an interactive ship's wheel type of device.

This design was called "Our Powers Combined". It was an early exploration of interactions that function when users work together

This quick study was from a potential outdoor installation site showing the basic layout of the space.
This was a design for an interactive ship's wheel type of device.

Production

The squares with blue outlines are our aluminum foil capacitive touch sensors. The boards are opened to show these patches.

Built out of plexiglass, pegboard, and PVC, the interface is extremely light weight and modular.

The squares with blue outlines are our aluminum foil capacitive touch sensors. The boards are opened to show these patches.

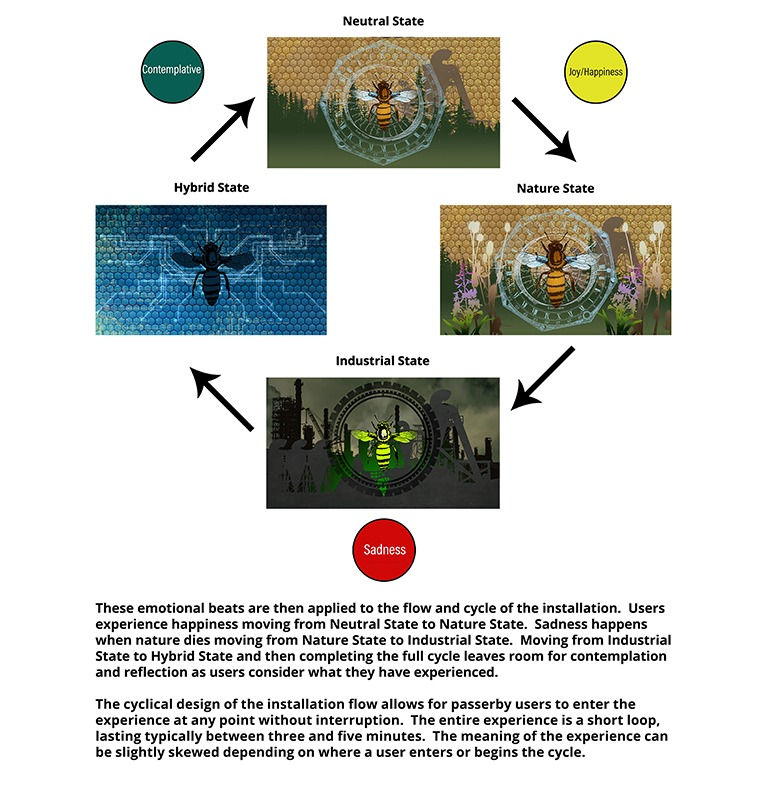

Various Charts from Design Style Guide
Storyboard of Interactions
Button Feedback and Hints

User Testing and Research


A grid was added to collected footage in post in order to track how users move around the installation space.

Participant of micro expression study exhibiting a surprise expression.
Two user testing research studies were done for this project. Heat mapping was used to learn more about how users interact with the installation space. Micro expression testing was used to track how well the imagery of the installation was meeting the emotional beat targets.


Hesitater players are players that don't interact with the interface directly for upwards of 30 seconds into testing. (Note time stamp at bottom of grid).

This image shows the combined data for all 12 participants during the 6 minutes of testing. The information is cumulative as participants activate individual quadrants as they move around the installation space.
Heat Map Player/Group Types
Sample Heat Map Data Video- All Groups Combined
Sample Micro Expression Video- Sadness

This chart shows the results from the micro expression study.

A/B testing was used by changing the order of the image slides. This was done to increase internal test consistency.

Exhibition


Folks trying out the installation.